This page is dedicated to my personal project that aims to visualize many different aspects of my creative process.
No matter how much we all try to ground our ideas in simplicity, the process of solving a creative problem is often chaotic. With this project, I try to make sense of the chaos by trying to pin-point the stages of my creative process. I use time as my constant [represented as a straight red line] and map my process around it.
The first process infograph I ever made was about mapping out how I spend my time on a project. For the most part, I’m always impressed with how much can get done in such a short period of time [thanks to project deadlines] and I wanted to see where most of my time and energy was going to.
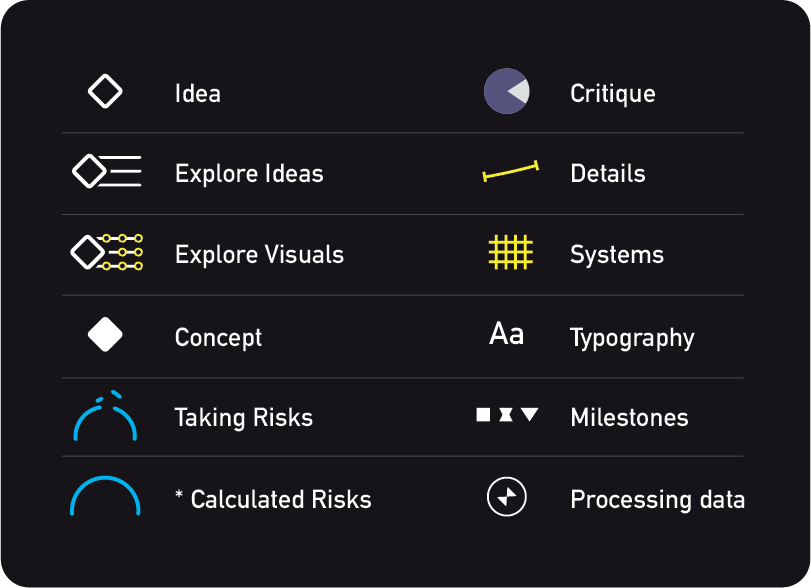
There is not much to say about the dangers confronting the first inner spiral of this diagram, for the chances are slim its structure will fail. Same is true for the end.
But the scale of the outer spiral can be prone to crashes because of the experimentation and the effort that can go into its implementation.
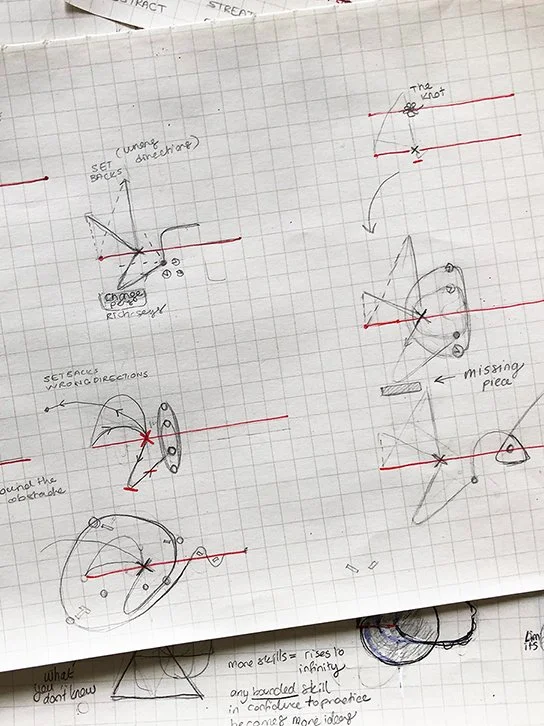
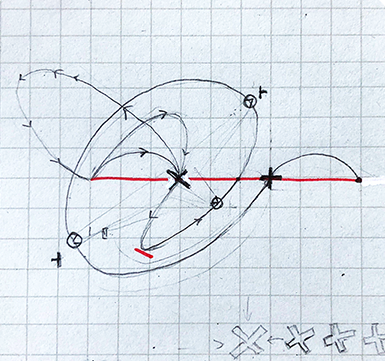
The X represents an obstacle in my way. Getting around it usually involves throwing different approaches at the problem area to see what works. Sadly, there are often setbacks or wrong directions. If the problem is worthy of attacking back, however, that means there is a general direction of the idea I can follow.
[INITIAL SKETCHES]
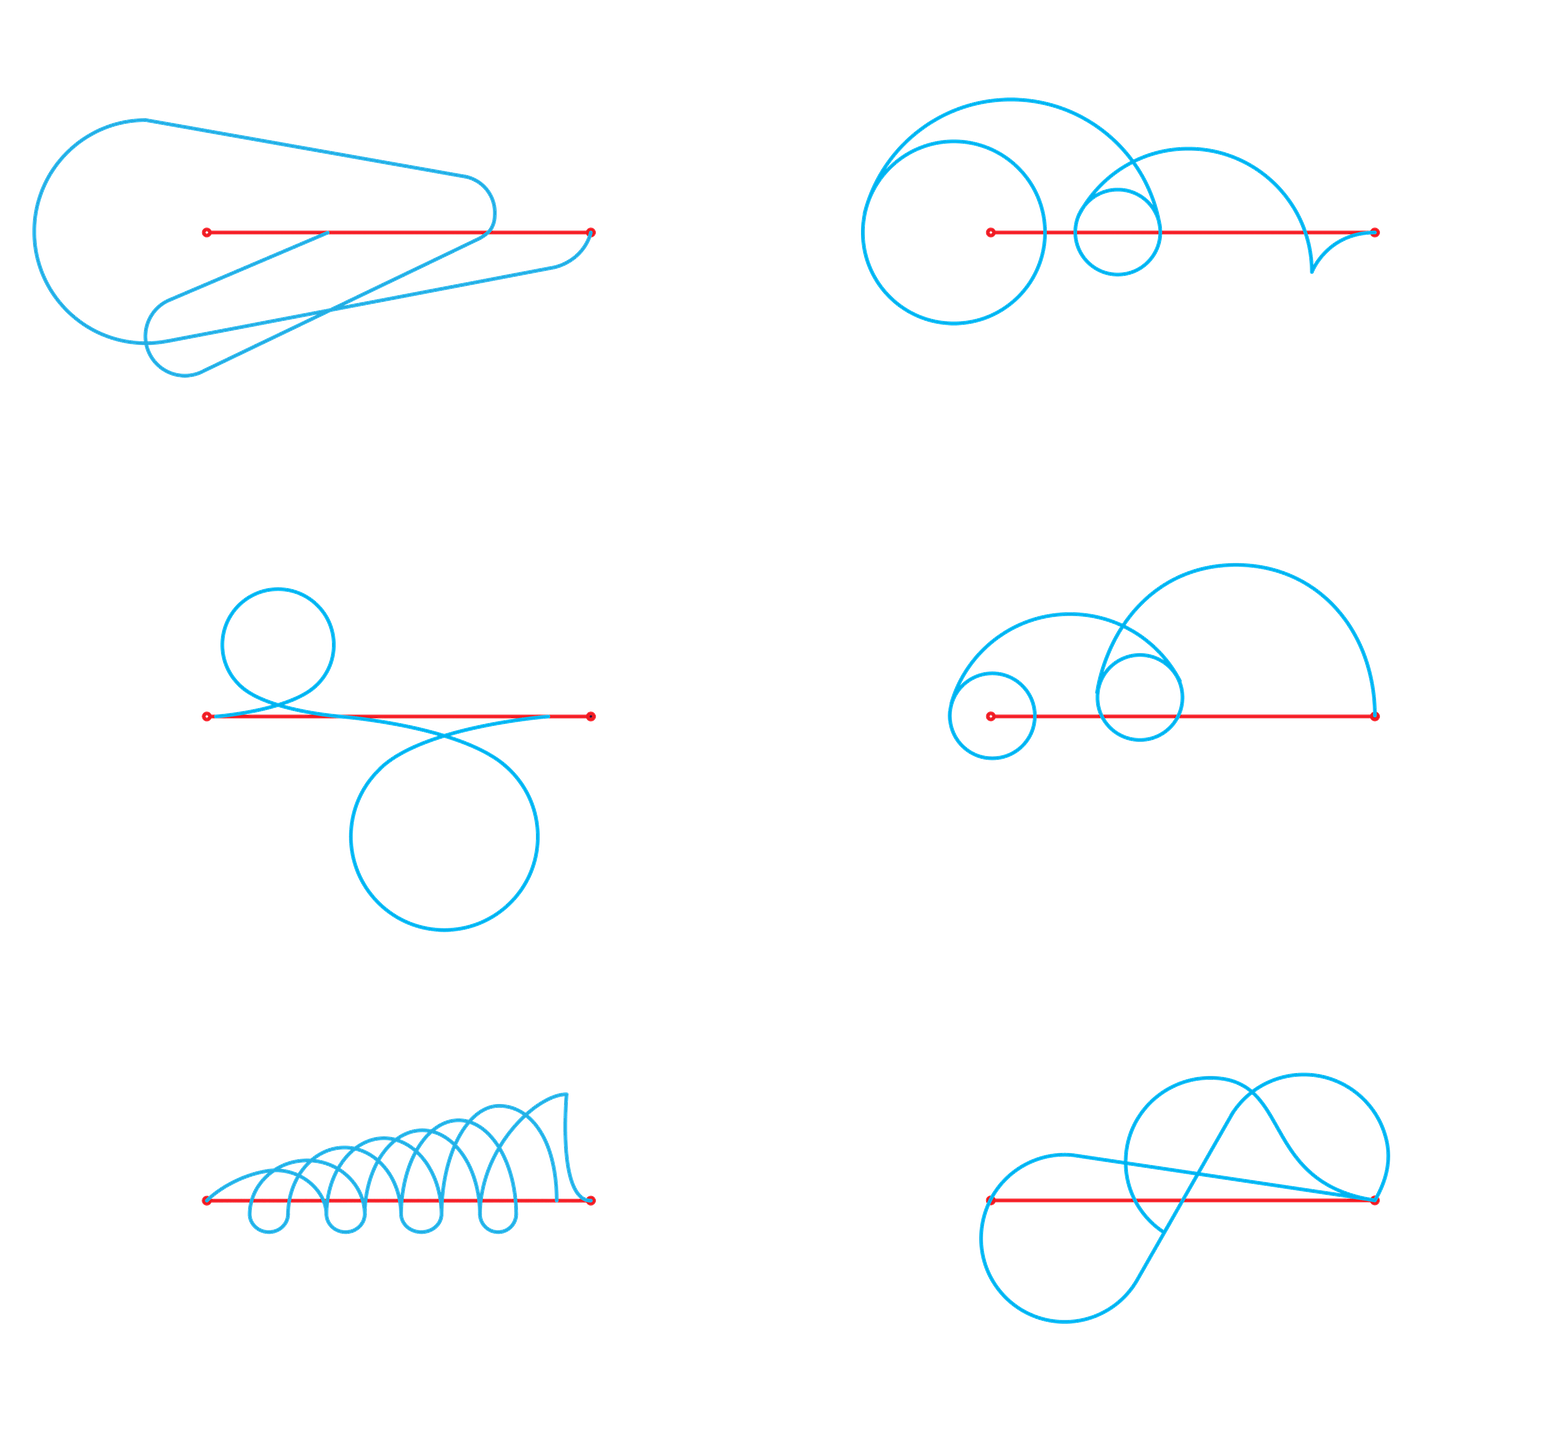
After creating the two main visualizations above, which are more inclusive in nature, I now map out more elusive parts of the creative process. Such as the process of coming up with a good idea or knowing when something is finished. These types of harder to explain concepts are an ongoing FUN activity of mine. THEY’RE A BIG WIP :) so below I’ll only share a couple for now.
Above: Traversed lines all marching to different beats, here I’m showing how I venture out of my comfort zone and deal with having endless possibilities.
Below: By exploiting an old idea, and adding new thoughts onto it, a brand new chain of development forms and often leads me to unique and unexpected outcomes.


